Our homework prior to our 5th class of Honors Biology was called House Case #1, in which we had to come up with 3 diagnosis for a patient. The patient in this case was an 18-year-old high school cross-country runner, and the issue is that he began vomiting and complaining about a severe headache at his cross-county practice. He also said that he was very tired and confused.
For my three diagnosis, I chose heat stroke, dehydration, and head trauma, such as a confusion. I found that the symptoms of all three of these possibilities included vomiting, headaches, tiredness, and confusion( among other symptoms). I will wait until next class to go into the details of my arguments for each of these hypothesizes.
During this class, we discussed the results of the experiments from the previous class, and drew graphs in order to find out the molarity of the four different potatoes tested.
 |
| Graph showing the estimated molarities of the potatoes. The % mass change was used as the y-axis, and the molarity of the six solutions was used as the x-axis. |
The point in which the lines cross the x-axis can also be seen as the point where the mass did not change. If the mass did not change, then the cell and the outside solution had the same molarity. So in essence, the point which the line crosses the x-axis will be equal to the molarity of the cell, or potato. Each above molarity was estimated through the use of the graph.
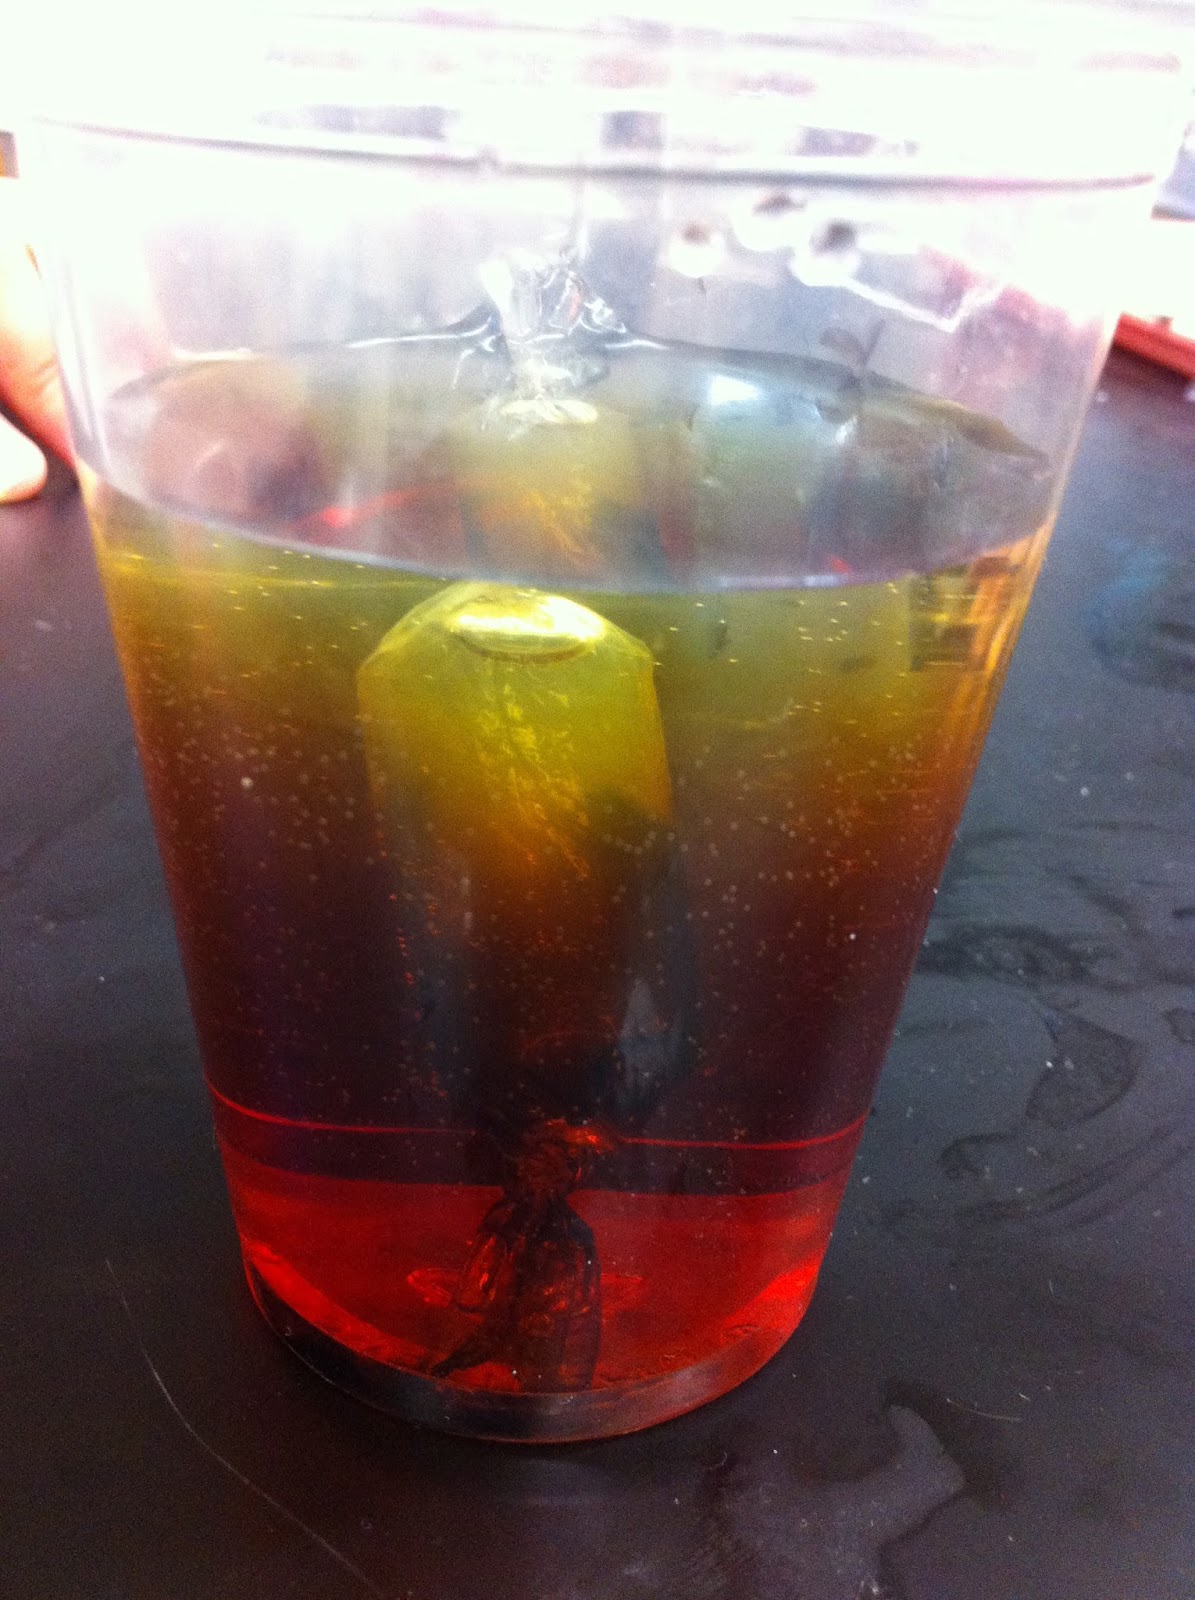
We also did an experiment where we put 7ml of a solution with a composition of 15% glucose, 5% starch, and 80% water into a dialysis tube. We then used a glucose strip to test the solution in this cell, and the strip turned brown. We also tested the water with the glucose strip, and that resulted in no color change, reassuring us that their was no glucose already in the water. Next, we placed the cell into a cup of water so that it was covered, and waited for about 15 minutes.
 |
| Glucose/Starch cell sitting in water. |
Then we added iodine to the outside solution. Since starch is an indicator for iodine, the iodine should turn dark blue/black where starch is present, and brownish-yellow where there is no starch present. Since the outside solution turned brownish-yellow, it can be reasoned that the starch was not able to make it though the dialysis tubing.
Since the starch was not able to pass through the dialysis tubing, the concentration of starch in the cell remained the same. And when iodine, which was able to pass through the dialysis tubing, was added to the cup, it reacted with the starch and turned dark blue/black.
 |
| Iodine added |
We also tested 7ml of the starch/glucose solution in a cup with 1ml of Benedict's. Once these two were added together in the test tube, we heated it in water, so that the reaction would occur at a faster rate.

The color that the solution turned can be used to determine the amount of glucose. Since this solution turned orange, it can be determined that there is a lot of glucose in the solution.

We also did an experiment where we let three different sized "cells", one representing long hair cells, one skin cells, and the other one a plant cell.
We covered three different shaped cells in NaOH, and another three different shaped cells in KI, and measured how far they diffused after two minutes. Each cell diffused between two and three millimeters. We measured the surface areas of the three cells and recorded them. It appears that the solutions will be able to seep into the nucleus faster.
Well done post. The diffusion in the cells was at a specific rate and the difference in size allows the depth of diffusion to reach the middle.
ReplyDelete